Wednesday, May 28, 2008
Currently uptrend still intact albeit the volatility. Resting on support at the moment, testing it.

The 1st 2 counters I bought when I first started.
This counter has been on the top volume almost everyday these few days, sustaining lots of selling pressure. It's recent uptrend has been broken with 2 dojis, to me it's "hesistation".
Using Fibbo, it can be seen that 0.985 is a support which has yet been breached for 2 consecutive days of testing that line. Intraday wise, there's pretty much of buying at 0.985. Should this be broken, it's 0.935 but then again, this price seems pretty strong at the moment.
Tuesday, May 13, 2008

Sorry if my chart looks messy. I just thought of including the bollinger band cause it seems to show the Resistance and Support pretty clearly.
To me for short term, 5d MA seems acceptable but then it's subjective and differs from individual. Last closing broke 5d MA. Not very nice, but not totally hopeless.
Support as seen from bollinger band is near 0.72, which is supported by the candlesticks as shown.
Monday, May 12, 2008

3.15 Support, period
Note that in almost every May the share price will definitely drop. Nothing to be seriously worried about since it's after it's Div payout. I've got the impression or read that this company's payout is 100%. So a dip in share price due to the outflow of cash, is perfectly normal.
Fundamentally, I've yet to really go into it deep, but I've got the impression that this coy is good. I mean how can it not be? It's ST, and who is it's backer? Who does maintainance for SAF? 100% payout! Or am i mislead? ha!

This counter appeared on my shortlist ever since I saw it's trading channel from 3.6 to 4. But my interest on it increased on it's recent breaking of it's 200MA.
I'm waiting to collect at the price range of 3.61-3.63, if it ever happen but anyway, I read from sharejunction that they will annouce their results coming Wednesday. So 'll just be patient till then.
If it comes, it comes. Else it's alright cause I've got ST Eng under my radar also.
Another heavy weight trending on support.

Taken from Soccernet.
Once again, reconfirmed as champions!
An old bird closing the chapter,scoring the last goal, in the league for the club for Year 07/08.
A young bird hitting 41 goals, with 1 more game to go.
Nothing materially gained from them being champions but it's just good to see them win the league. Pride! Ha!
Next up, UCL in 9 days time.
Another hit on Chelsea's ego would sum up a very satisfactory season for Man United!
We are the champions.... We are the champions.... We are the champions !!!!
Saturday, May 3, 2008

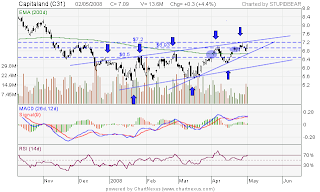
I've made a huge mistake at my entry price on this counter. A simple analysis is shown on the chart.
Rightfully, I've spotted the trend that it rebounds off it's peak and off it's support. If one manage to catch the 2nd and 3rd rebound off the support and the 3rd and 4th rebound off the peak, I think that person is a happy man. =) I din, but I've learnt a bit in my 1st ever serious short position.
I did not take time to observe the movement of the counter but hastily entered a position quite off the possible peak. I was impatient. Note: Shorting is a total different ball game all together.
Taking a closer look on hindsight, I think I learnt a few things off this 1st short position.
People interested in shorts, dun plunge head in. Do a more detailed analysis.
More profits can be taken from a short if done right. Be careful.
Friday, May 2, 2008

In response to DJ breaking of the 13000 barrier I previously posted, STI reacted in the similar reaction today. As pointed out by my friend, TraderStudent, a Inverse H&S formation is spotted but not completed.
But the postive thing to note, despite the possible failure is that STI is still above 3,150, a resistance turned support as seen on the previous days of trading.
Today, with STI closing
1. Slightly above 200MA
2. Above the neckline of the inverted H&S
3. Above the support line drawn, this is subjective
4. Considerable volume.
Are we going to trend along this region or drop. This is the million dollar question, nevertheless HSI, has recovered it's gap. Technically, we are recovering, but then again, bombs could be dropped again to supress the prices for the BIG PLAYERS to earn more, as usual.
The news creator, analysts = Biggest earners. Agree? To me, it is.
Thursday, May 1, 2008

It has been some time since I've done a chart on index.
Few things worth noticing, the channel DJ is now in. It is currently, FINALLY, trading above it's 200MA, not by a lot but a little. Nearest resistance not too far off at around 13000.
Not all is bad now on the chart, although almost 120 points of gains wad given up in the last 2 hours of trading on DJ when FED talked a bit too much =)
Let's see if this current trend can hold/break.
Oh! My FIRST dividends has been declared. This is emotional, exciting, this is history in the making!!!
